Data will become precious as gold – Make faster decisions thanks to VIVAVIS Dashboard
New ways of generating and distributing energy demand for new approaches to guarantee reliable and secure power supply. Thus, integrated acquisition and visualization of data relevant for decision-making processes are vital.
Our VIVAVIS Dashboard keeps you up to date with the status of your network. Key performance indicators of your network are provided by hardware and software.
Complexity meets digitalization – a tough challenge
Energy grids are becoming more and more complex. Already today, huge data volumes are continuously exchanged in real time in between generation and consumption. Digital solutions deliver information about the condition of the entire grid and its components.
There is almost no time to rest as digitization is driven farther by, for example, approaches to control large grids with only small staff or strategic amalgamation of IT systems based on internal changes to organizational structures.
Thus, it becomes more and more important to enable and improve decision-making processes based on digital information. Pieces of information provided by expert systems are no longer sufficient. Instead, you must rather condense data provided by many sources to meaningful results.
Face the challenge – data as basis of decision-making
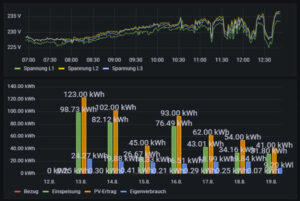
Energy dashboards are exactly what you need to address these challenges as they help to make information about energy systems available at the touch of a button. By means of dashboards, you are able to monitor processes more precisely and make well-founded decisions. You may even combine information provided by different processes.
Our VIVAVIS Dashboard visualizes data delivered by control system (HIGH-LEIT), metering system (IDSpecto.DAYOS), EP2000, third-party systems such as ERP and sensors. Data is displayed in a browser-based viewer on your desktop computer, smartphone or tablet.
Dashboards can be customized for various use cases. The following prototypes are available:


Device information is visualized in map views. Operators may use information provided by status monitoring and security events to analyse the conditions of the distributed energy automation systems. The dashboard offers risk detection and alarms, which help to optimize maintenance.
Our VIVAVIS Dashboard aims at helping our customers consolidate data system-wide and thus be able to face the challenges of digitization. Furthermore, the ability of the dashboard to collect data from different systems offers the opportunity to analyse data or create reports.
Discover our VIVAVIS Dashboard!
Are you eager to learn more?
Do not hesitate and contact our VIVAVIS Dashboard specialist
Nico Brunner
Product manager
Email: nico.brunner@vivavis.com


